Quality failures and uneven reliability are what really hurt importers: rework, delays, penalties, and unhappy customers.
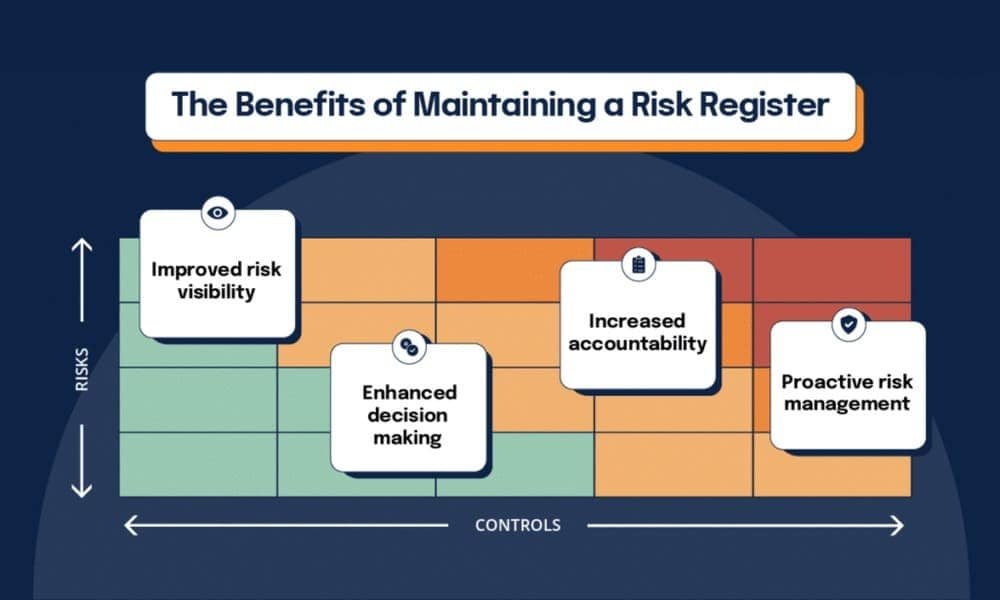
A lightweight, spreadsheet-based risk register gives you visibility, ownership, and a rhythm for action.
This step-by-step guide shows how to build a practical China supply chain risk register you can start using today—anchored on supplier reliability, quality, and inspections—plus a blank template you can copy into Excel or Google Sheets.
Set up your China supply chain risk register (quick start)

Keep your fields focused on action. Each column should exist to drive a decision, an inspection, or a review.
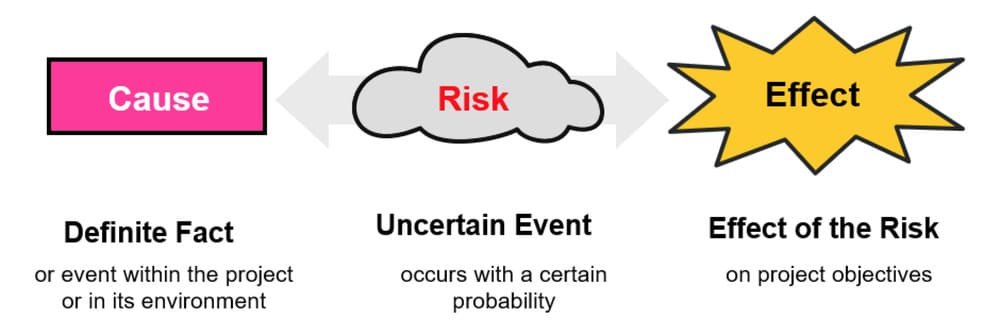
- Risk ID, Title, and Cause→Event→Effect description: clear enough that anyone on the team understands the risk without a meeting.
- Category and Affected Supplier/Process: group risks (quality, delivery, compliance) and tag the supplier or process so trends emerge.
- Trigger(s): the observable signals that tell you a risk is materializing (e.g., PSI fail, DuPro yield drop, LNY shutdown notice).
- Inherent Likelihood, Inherent Impact, Inherent Score: your first pass rating before treatments.
- Existing Controls and Planned Treatments: inspections (FAI/DPI/PSI), AQL targets, corrective actions, audits.
- Owner, Due Date, Status: accountability and time-bound action.
- Evidence Link(s): PSI reports, FAI photos, test certificates, packaging checks.
- Residual Likelihood, Residual Impact, Residual Score: rating after controls are applied.
- Acceptance Decision and Review Cadence: accept, monitor, or escalate; set next review.
Step-by-step: Build your register
Step 1: Create your sheet and columns
Copy the CSV below into a new file, then import to Excel or Google Sheets. It sets up all essential fields for a practical China supply chain risk register.
Risk ID,Title,Description (Cause→Event→Effect),Category,Supplier,PO/Batch,Trigger,Inherent Likelihood (1–5),Inherent Impact (1–5),Inherent Score,Existing Controls,Planned Treatments (Owner & Due Date),Treatment Owner,Treatment Due,Residual Likelihood (1–5),Residual Impact (1–5),Residual Score,Acceptance (Accept/Monitor/Act),Status (Open/Closed),Last Review,Next Review,Evidence Link
1,,,(Quality),,,,(1–5),(1–5),,,,(Name),(YYYY-MM-DD),(1–5),(1–5),,,,(YYYY-MM-DD),(YYYY-MM-DD),
Pro tip: Freeze the header row and apply a filter view so owners can slice by supplier, category, and status.
Step 2: Set your scoring scales and color bands
Use a simple 5×5 qualitative matrix. Score = Likelihood × Impact. Map bands to actions and cadence.
| Likelihood | Impact | Score Bands | Risk Level | Action & Review |
|---|---|---|---|---|
| 1–5 | 1–5 | 1–5 | Low | Log and review quarterly |
| 6–10 | 6–10 | Medium | Mitigate; review monthly | |
| 11–15 | 11–15 | High | Act now; review biweekly | |
| 16–25 | 16–25 | Extreme | Immediate containment; weekly review |
In Google Sheets, add conditional formatting using custom formulas, for example:
- High or above: =$H2*$I2>=15
- Medium: =AND($H2*$I2>=6,$H2*$I2<=10)
- Low: =$H2*$I2<=5
In Excel, use Conditional Formatting → “Use a formula to determine which cells to format” with the same formulas. Restrict Likelihood/Impact entries to integers 1–5 via Data Validation.
For fundamentals on qualitative matrices and register elements, see PMI’s explainer on risk registers: Risk Register in Project Management (Project Management Academy, 2024–2026).
Step 3: Define triggers and inspection checkpoints
Make your triggers observable and tied to inspection checkpoints.
- FAI (First Article Inspection): validates first pieces/tooling before mass production.
- DPI/DuPro (During Production Inspection): mid-production check (e.g., 20–60%) to catch issues early.
- PSI (Pre-Shipment Inspection): final random check when ~80% packed; uses AQL sampling.
- AQL targets by defect class: critical 0.0; major 1.0–2.5; minor 2.5–4.0 are common for consumer goods.
Operational explainers on inspection types and AQL sampling are well documented by inspection firms.
For a practical overview, see GIS Inspection’s guide to inspection types (2025–2026): GIS Inspection’s guide to inspection types (2025–2026) and QIMA’s AQL explainer (2025–2026).
Step 4: Log your first risks with cause→event→effect statements
Examples:
Cause: Supplier changes packaging vendor without drop testing → Event: PSI finds major packaging defects exceeding AQL 2.5 → Effect: shipment delay and rework.
Cause: Assembly rejects spike during DuPro → Event: yield drops below threshold → Effect: additional labor, schedule slip.
Cause: Factory announces Lunar New Year closure dates late → Event: bookings miss cutoff → Effect: extended lead times and stockouts.
Step 5: Assign owners, treatments, due dates, and evidence
Treatments should be concrete: tighten AQL, add DuPro, run process audit, retrain operators, qualify an alternate supplier, or pull forward POs before LNY.
Link the evidence: PSI report PDF, FAI photo set, test certificates, audit checklist.
Step 6: Calculate residual risk and decide acceptance vs. action
After controls, re-score likelihood and impact.
If residual score stays high/extreme, escalate: containment stock, re-inspect, or redirect volumes to qualified alternates.
If residual falls to medium/low, move to monitor with a defined next review.
Step 7: Establish review cadence and light automation
Tie cadence to risk level: High monthly (or biweekly during incidents), Medium quarterly, Low annually. Automate reminders via calendar invites or sheet add-ons.
Governance explainers summarize common cadences and matrix usage; see AuditBoard’s risk assessment matrix overview (2025).
China-specific examples you can copy into your register

Here are five sample rows. Adjust numbers to fit your product and suppliers.
- Title: PSI failure — packaging defects exceed AQL 2.5
- Description: Vendor change without validation → PSI finds major defects > Ac 10 → rework and re-inspect → ship delay.
- Trigger: PSI major defects exceed AQL 2.5 (ISO 2859-1 sampling).
- Inherent L/I: 4 × 4 = 16 (Extreme). Controls: tighten AQL; packaging spec update; vendor training.
- Planned Treatments: add DuPro; require packaging drop test certificates; Treatment Owner: QC lead; Due: 2026-02-05.
- Residual L/I: 2 × 3 = 6 (Medium). Acceptance: Monitor. Evidence: PSI report link.
- Title: DuPro yield drop below 95%
- Description: Operator training gap → assembly rejects spike → throughput loss.
- Trigger: DuPro rejects > threshold.
- Inherent L/I: 3 × 4 = 12 (High). Controls: process audit; SOP retraining.
- Planned Treatments: add FAI on revised parts; QC owner; Due: 2026-01-25.
- Residual L/I: 2 × 3 = 6 (Medium). Acceptance: Monitor. Evidence: DuPro report.
- Title: Packaging drop test failure
- Description: Carton strength mismatch → ISTA drop test fail → risk of transit damage.
- Trigger: Lab test fail on 10-drop sequence.
- Inherent L/I: 3 × 5 = 15 (High). Controls: spec revision; carton upgrade; PSI packaging checks.
- Planned Treatments: vendor training; pre-production sample test; Due: 2026-01-30.
- Residual L/I: 2 × 3 = 6 (Medium). Acceptance: Monitor. Evidence: test certificate.
- Title: LNY shutdown announced — capacity risk
- Description: Factory closure 2/8–2/22 → pre-holiday congestion → missed sailing.
- Trigger: Closure dates posted; carriers announce blank sailings.
- Inherent L/I: 4 × 5 = 20 (Extreme). Controls: pull orders forward 2–4 weeks; build safety stock.
- Planned Treatments: early bookings; alternate routing or mode; Due: 2026-01-15.
- Residual L/I: 3 × 3 = 9 (Medium). Acceptance: Monitor. Evidence: forwarder advisory.
- Title: Supplier scorecard drop — reliability
- Description: OTD < 92% over 90 days; defect PPM rising.
- Trigger: KPI breach on scorecard.
- Inherent L/I: 3 × 4 = 12 (High). Controls: corrective action plan.
- Planned Treatments: qualify alternate supplier; shift 10–20% volume; Due: 2026-02-01.
- Residual L/I: 2 × 3 = 6 (Medium). Acceptance: Monitor. Evidence: scorecard dashboard.
For timing norms around LNY and planning buffers, see Maersk’s Chinese New Year advisory (2026): Maersk’s Chinese New Year advisory (2026) and Freightos’ shipping delay guidance.
Practical workflow: coordinating PSI and updating your register

Disclosure: Yansourcing is our product.
A neutral, replicable workflow many teams use:
- book a PSI at 100% production and ≥80% packing;
- share your AQL targets (critical 0.0; major 2.5; minor 4.0) and QC checklist;
- receive the PSI report and record pass/fail, defect counts, and actions in the register;
- if defects exceed accept numbers, trigger rework and re-inspection, then update residual risk.
A sourcing and inspection coordination partner can help execute PSI scheduling, collect AQL data, and manage corrective actions with the factory.
The workflow remains the same whether you do it internally or with a partner; the key is to tie the PSI outcome directly to your risk register row and review cadence.
Troubleshooting and common errors
Common pitfalls include stale entries, inconsistent scoring, owner gaps, inspection bottlenecks around LNY, and missing evidence.
- Enforce Last/Next Review dates and automate reminders;
- provide scoring rubrics and validation lists with short training;
- make Treatment Owner and Due Date mandatory;
- book inspectors early and add DuPro or tighten AQL temporarily;
- and never mark treatments complete without a report, photo set, or certificate.
Light automation and integration tips
Use Google Sheets Data validation lists for Likelihood/Impact and custom-formula conditional formatting; in Excel, apply Data Validation (list 1–5) and banding formulas for color rules.
Create recurring calendar events tied to “Next Review,” and link register IDs to ERP/WMS tickets or supplier NCRs so actions are trackable.
References and further reading
- ISO 31000 overview of the risk process and recording expectations: ISO publication page (2018–2026).
- PMI-aligned overview of risk registers and probability–impact matrices: Project Management Academy’s explainer.
- AQL sampling and defect classes: QIMA’s AQL guide; inspection procedure notes: QIMA PSI procedure.
- Inspection types for importers: GIS Inspection’s four types guide.
- LNY planning timelines: Maersk’s CNY advisory; Freightos guidance.
To turn the CSV into a ready-to-use register, import the file into Sheets/Excel, add the Likelihood×Impact formula into Inherent Score and Residual Score columns, and apply conditional formatting band rules.
Then start logging your first 5–10 supplier reliability and quality risks today.
