
Building a supplier scorecard isn’t about policing factories; it’s about making performance visible so you can improve together.
If you import from China, two pillars move the needle more than anything else: Quality and Delivery.
In this tutorial, you’ll build a weighted scorecard—grounded in clear formulas, practical business rules, and a worked example—that you can roll out with your vendors for ongoing performance management and continuous improvement.
Step 1: Set the purpose, scope, and weights

Keep the focus on continuous improvement across live suppliers, not vendor selection.
Assign the highest weights to Quality and Delivery—typically 40–50% each—because defects and reliability directly hit customer experience, returns, inventory, and working capital.
Use any remaining 0–20% for low-weight categories such as Compliance & Risk, Flexibility & Service, and ESG, but avoid diluting attention.
Calibrate by product criticality and volume; a safety-critical item might use Quality = 50%, Delivery = 40%, Other = 10%.
Many OEMs set tight defect expectations—for example, the Donaldson Supplier Quality Manual (2025) cites ≤50 DPPM, underscoring why Quality deserves heavy weight.
Step 2: Define data sources and business rules up front
Before you calculate anything, establish what counts—literally.
- Data sources: incoming QC logs (AQL results, defect counts), receipt quantities, PO lines and promise dates, ASN and goods-receipt timestamps, carrier delivery confirmations.
- Units of measure: choose one basis for Delivery metrics (PO line vs shipment vs case) and stick to it.
- Time windows and zones: define the delivery window (e.g., promised date ±1 day) and which timestamp is “delivered” (dock scan vs WMS receipt). Keep time zones consistent (China Standard Time vs destination).
- Partials and split shipments: document whether partials count as failures unless pre-approved. Aggregate split shipments back to the PO line to assess “in full.”
- Holiday rules: encode Chinese New Year and Golden Week blackout windows; pause or widen on-time tolerance during agreed shutdowns while still tracking pre-holiday planning and post-holiday recovery. Capacity and schedule adjustments are common, as noted in Maersk’s Chinese New Year guidance (2025).
Step 3: Build the Quality pillar (formulas and scoring)
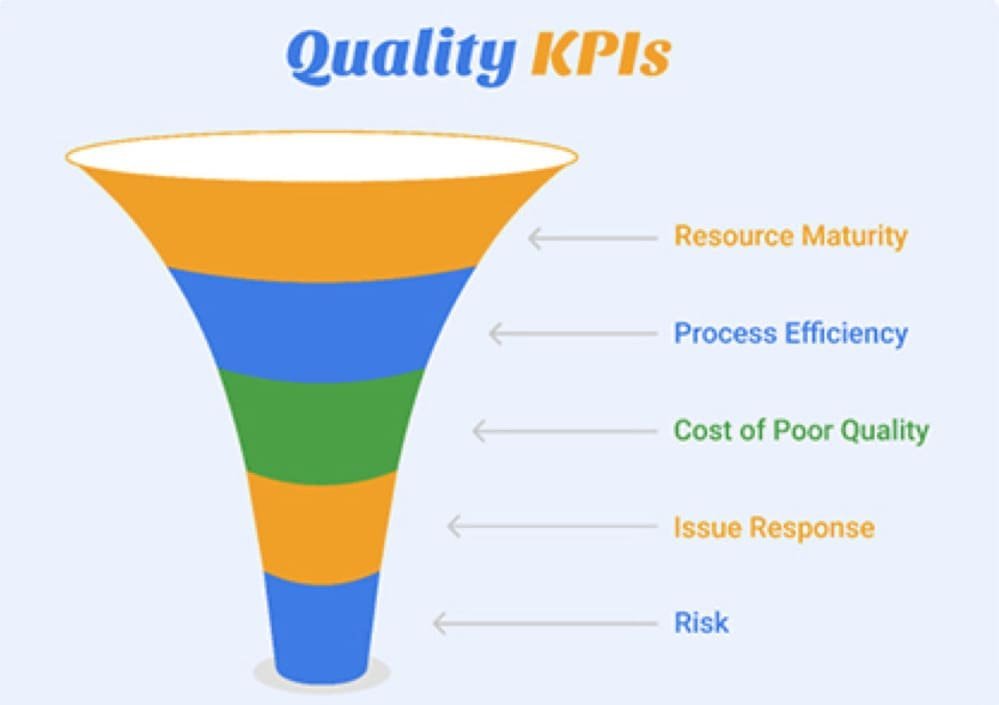
Define Quality KPIs with unambiguous formulas and map them to 0–100 scores.
- DPPM (defects per million, receipt basis) = (Total nonconforming quantity ÷ Total receipt quantity) × 1,000,000. This formulation is explicit in the AM General Supplier Quality Manual (2023).
- FPY/FTQ (%) = (Units that pass on first attempt ÷ Units entering) × 100.
- Incoming inspection pass rate (%) = (Accepted units ÷ Inspected units) × 100 (or lots basis). This complements AQL sampling practice.
Example scoring bands for consumer goods (tune to category):
| Quality KPI | Excellent | Good | Fair | Poor |
|---|---|---|---|---|
| DPPM | ≤200 → 100 pts | 201–1000 → 85 pts | 1001–5000 → 70 pts | >5000 → 40 pts |
| FPY | ≥98% → 100 pts | 95–97.9% → 85 pts | 90–94.9% → 70 pts | <90% → 40 pts |
| Incoming pass rate | ≥98% → 100 pts | 95–97.9% → 85 pts | 90–94.9% → 70 pts | <90% → 40 pts |
Within the Quality pillar, either (a) average the KPI scores then apply the pillar weight, or (b) assign sub-weights to each KPI that sum to the pillar weight. Keep documentation clear so future reviews are repeatable.
Step 4: Build the Delivery pillar (OTIF, lead-time reliability, and holiday logic)
Delivery is about promise integrity and predictability.
- OTIF (%) = (Deliveries that are both on-time AND in-full ÷ Total deliveries) × 100. Use intersection logic, not averages of “on-time” and “in-full.” For definitions and implementation nuances, see Celonis’s OTIF explainer (2023).
- Lead-time reliability (%) = (Orders within tolerance ÷ Total orders) × 100, where tolerance is the allowed variance around the SLA lead time (e.g., ±2 days). KPI design patterns appear in IFS’s supplier performance KPIs (2023).
Example Delivery scoring bands (define window and tolerances explicitly):
| Delivery KPI | Excellent | Acceptable | Corrective Action |
|---|---|---|---|
| OTIF | ≥95% → 100 pts | 90–94% → 85 pts | <85% → 40 pts |
| Lead-time reliability | ≥95% → 100 pts | 90–94% → 85 pts | <90% → 70 pts |
China-specific holiday rules to encode:
- Apply agreed blackout or widened tolerance around Chinese New Year and Golden Week. Factories often slow pre-holiday and need weeks to ramp back up; logistics networks also adjust capacity and schedules. See Maersk’s Chinese New Year guidance (2025).
- Track pre-holiday planning and post-holiday recovery separately so you reward good planning (e.g., early booking) and identify true capacity issues rather than penalizing agreed shutdowns.
Step 5: Build the template (spreadsheet-ready)
Structure your sheet so the math is transparent and validated.
- KPI calculation cells:
- DPPM = (NonconformingQty ÷ ReceiptQty) × 1,000,000
- FPY (%) = (FirstPassGoodUnits ÷ UnitsEntering) × 100
- Incoming pass rate (%) = (AcceptedUnits ÷ InspectedUnits) × 100 (or lots basis)
- OTIF (%) = (Count_OnTime∧InFull ÷ TotalDeliveries) × 100
- Lead-time reliability (%) = (Count_OrdersWithinTolerance ÷ TotalOrders) × 100, where WithinTolerance = |ActualLeadTimeDays − SLA_LeadTimeDays| ≤ ToleranceDays
- Business-rule cells:
- Delivery window: OnTime = DeliveredDate ∈ PromiseDate−1day,PromiseDate+1dayPromiseDate − 1 day, PromiseDate + 1 dayPromiseDate−1day,PromiseDate+1day (example)
- Quantity tolerance: InFull = DeliveredQty ≥ OrderedQty and ≤ OrderedQty × (1 + OverShipTolerance%) unless forbidden
- Partials: aggregate split shipments to the PO line within the window before evaluating “in full”
- Holidays: list annual CNY/Golden Week windows; apply blackout/tolerance logic
- Normalization to 0–100: map each KPI to a score via the rubric bands; then compute pillar rollups and the composite: Composite = Σ(weight_i × score_i). Add a validation cell that turns red if weights ≠ 100%.
Step 6: Worked example (Supplier A, 3-month window spanning a holiday)
Scenario: Consumer electronics accessories (Q3–Q4), with Golden Week in October. Weights: Quality 45%, Delivery 45%, Other 10% (Service 5%, Compliance 5%). Assumptions: delivery window ±1 day; “in full” requires 0% short; agreed Golden Week blackout Oct 1–7.
Illustrative KPI values and mapped scores:
| Pillar/KPI | Measured Value | Score (0–100) | Pillar Contribution |
|---|---|---|---|
| Quality: DPPM | 350 | 85 | 45% × 85 = 38.25 |
| Quality: Incoming pass rate | 97.2% | 85 | (sub-weighted or averaged within Quality) |
| Quality: FPY | 96.5% | 85 | (sub-weighted or averaged within Quality) |
| Delivery: OTIF | 92% | 85 | 45% × 85 = 38.25 |
| Delivery: Lead-time reliability | 88% | 70 | (sub-weighted or averaged within Delivery) |
| Other: Service (WeChat response <4h, documented) | Meets | 85 | 10% × 85 = 8.5 (if Other is aggregated) |
To finish the math, first compute each pillar’s internal average/sub-weight total, then apply the pillar weight. For example, if the Quality sub-KPI average = 85, Quality contributes 38.25 points to the composite. If the Delivery sub-KPI average = (85 + 70) ÷ 2 = 77.5, Delivery contributes 45% × 77.5 = 34.88 points. Summing across pillars produces the composite supplier score out of 100.
Notes specific to the example:
- Use an intersection count for OTIF: OnTime ∧ InFull only; see Celonis’s OTIF explainer (2023).
- Apply the Oct 1–7 blackout to on-time determinations, but review pre-holiday weeks separately; if OTIF dips to 88% in the week before Golden Week, open a corrective action focused on early booking and capacity reservation.
Step 7: Governance, reviews, and continuous improvement

Tie the scorecard to routines so it drives action instead of sitting in a folder.
- Monthly operational review (60–90 minutes): walk KPI variances, agree containment and corrective actions (8D/5-Why), and update owners/dates.
- Quarterly business review (QBR): analyze trends across Quality and Delivery, compare pre/post holiday performance, and make fact-based allocation decisions. Supplier performance management guidance appears in Ivalua’s SPM overview (2025).
- Corrective actions: trigger an 8D if any KPI enters the “Corrective Action” band (e.g., OTIF <85% or incoming pass rate <90%). For methodology, see 6sigma.us’s 8D primer (2024).
Verification checklist (use monthly):
- Weights sum to 100% and pillar sub-weights are documented.
- OTIF basis and delivery window/tolerances match your contracts; holiday blackout windows are up to date.
- Partials are aggregated to PO line before evaluating “in full.”
- AQL sampling plans and accept/reject numbers are correctly applied; incoming pass rate basis (unit vs lot) is consistent.
- Cross-check OTIF intersection counts versus separate on-time and in-full counts; reconcile DPPM against defect and receipt quantities.
Practical workflow note (neutral example)

Disclosure: Yansourcing is our product.
If you don’t have in-house resources to collect inspection results and delivery timestamps across multiple factories, a China sourcing agent can be used to coordinate this workflow.
For example, you can ask the agent to:
(1) schedule pre-shipment inspections and share defect counts and AQL decisions;
(2) gather ASN and goods-receipt timestamps from 3PLs;
(3) confirm supplier holiday schedules and capacity reservations.
You then feed those inputs into your scorecard template and run monthly reviews based on the same rules and thresholds described above.
Common pitfalls and quick fixes
- Averaging “on-time” and “in-full” instead of using intersection logic for OTIF. Fix: calculate OnTime ∧ InFull only; don’t average separate rates.
- Switching OTIF units of measure mid-stream (order vs case) and breaking comparability. Fix: enforce one basis and document retailer exceptions.
- Misallocated weights (pillar vs KPI) leading to totals ≠ 100%. Fix: include a validation cell and a status indicator.
- Treating agreed holiday shutdowns as late deliveries. Fix: implement blackout/tolerance logic per contract; still review readiness and recovery.
- AQL misuse or inconsistent acceptance criteria. Fix: standardize inspection levels and acceptance numbers; keep a change log tied to ANSI/ASQ Z1.4 or ISO 2859-1 guidance. Useful primers include QIMA’s AQL guide (2025).
Wrap-up
A good supplier scorecard makes the important things measurable and the next actions obvious.
Put the weight where it matters—Quality and Delivery—set your business rules, and keep the cadence.
Start with the template and thresholds above, calibrate them to your category, and expand automation later (e.g., dashboards fed by PO/ASN and QC systems).
Want to keep things simple? Build the scorecard now, run it monthly, and let the continuous-improvement loop do its job.
